Home
This site shows some ways of interacting with Canvas Learning Management System (LMS) by means of R.
The exams (Zeileis et al. 2020) package is used to generate quiz zip files that can be imported into Canvas. This is much easier and faster than entering questions into Canvas’s GUI.
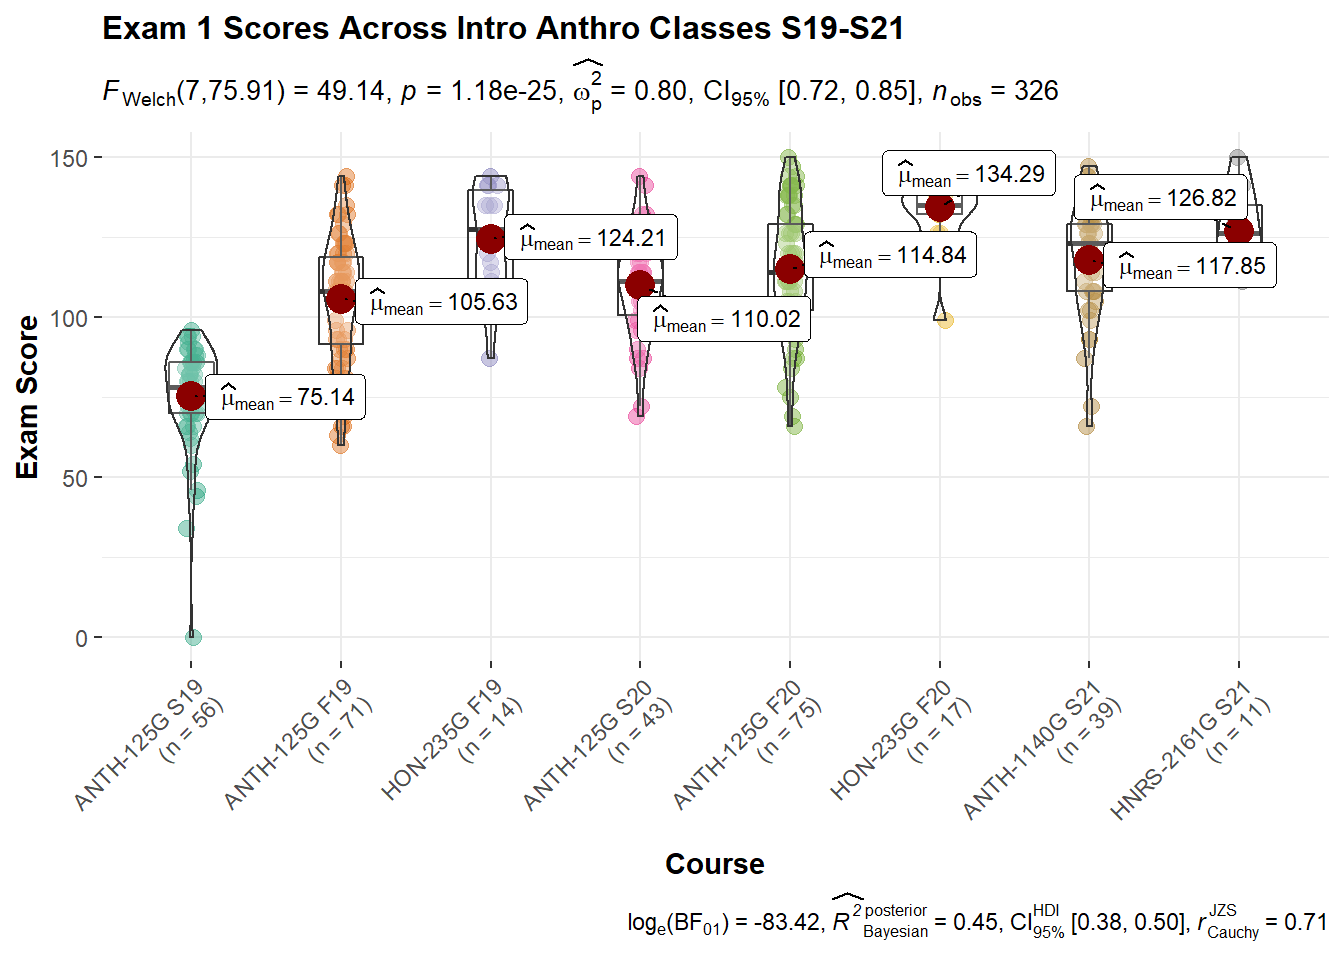
The rcanvas (Ranzolin, Hua, and Hathaway 2021) library is used to connect to NMSU’s instance of Canvas. The primary task is retrieving grade books. From there, the data are wrangled with dplyr (Wickham et al. 2021), summarized, and graphed with ggplot2 (Wickham et al. 2020) and ggstatsplot (Patil 2021).
The original R Markdown files containing the code can be accessed at the corresponding GitHub repository.
References
Patil, Indrajeet. 2021. Ggstatsplot: Ggplot2 Based Plots with Statistical Details. https://CRAN.R-project.org/package=ggstatsplot.
Ranzolin, David, Chris Hua, and J. Hathaway. 2021. Rcanvas: R Client for Canvas API. https://github.com/daranzolin/rcanvas.
Wickham, Hadley, Winston Chang, Lionel Henry, Thomas Lin Pedersen, Kohske Takahashi, Claus Wilke, Kara Woo, Hiroaki Yutani, and Dewey Dunnington. 2020. Ggplot2: Create Elegant Data Visualisations Using the Grammar of Graphics. https://CRAN.R-project.org/package=ggplot2.
Wickham, Hadley, Romain François, Lionel Henry, and Kirill Müller. 2021. Dplyr: A Grammar of Data Manipulation. https://CRAN.R-project.org/package=dplyr.
Zeileis, Achim, Bettina Gruen, Friedrich Leisch, and Nikolaus Umlauf. 2020. Exams: Automatic Generation of Exams in r. http://www.R-exams.org/.